Wednesday 9 April 2014


Reflective Synopsis


Even though I first bought a computer in 1996 and became familiar with the internet, I was really ‘green’ to all these technologies that we have explored in ICT for Learning Design up to the present date.  I did not know what a Wiki was, never read or made a blog, did have contact with Google Doc’s but did not know much about them, and never made a presentation or knew all the presentation tools that I do now.  It has been a steady learning curve for me in the IT world.  I was also introduced for the first time to pedagogy and other concepts, but I expected that on this course.  What I did not expect was to become part of the new breed of teachers offering ICT learning to students.  I do not believe I have achieved that goal yet, but I have a taste of the knowledge I need.

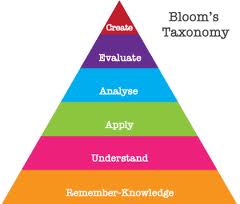
An area of our course I did have difficulty with was Bloom. One should not blame what we were kindly provided with, but the provision of this verb wheel completely bamboozled me: -


Picture 1.  Bloom’s taxonomy verb wheel.  As shown in week two learning materials. Source: http://teachonline.asu.edu/2012/10/aligning-assessments-with-learning-objectives/


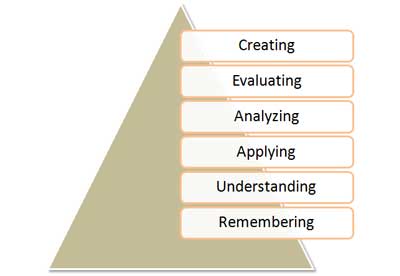
What would have helped more was the inverted pyramid that was shown (almost out of the observable range) in the top right hand corner of the link to Bloom’s taxonomy in week two’s learning materials.

Picture 2.  Bloom’s taxonomy.  Most important top to least important learning bottom. Source: http://www.nwlink.com/~donclark/hrd/learning/id/bloom_taxonomy.jpg


I found Bloom’s taxonomy a very hard thing to get my head around at first.  I must have reached my “buffer” in retention because I did not get the concept in week two and was bluffing in my reflective assessment for that week.  What really threw me was the other learning taxonomies also included on the web-page linked from the learning materials -- it just confused and overwhelmed me.  Bloom’s importance became clear when another subject in our course taught Bloom’s taxonomy and here I had a head start.  

Create your own Animation

We are trying to escape the learning theory Behaviourism (aka Objectivism) and move to the higher order thinking of being "Learning Managers" scaffolding what students learn.  To reflect on my own personal journey, being over the mid-life age mark, I am unable to recite almost all the mathematical formulas I learned at school and could not even do this fifteen years ago, at one occasion in my thirties, when asked if I knew the formula for the radius of a circle -- as a joke that I could not do it.  I am to be a biology teacher, however, I cannot remember thirteen years back to when I last learned the anatomy of the cell.  Obviously we forget things and therefore there is some merit in connectivism: like it or not, I am now a connectivist as I have to look these things up.  I do believe in Behaviourism for some aspects of learning, like for the anatomy of the cell, but think that Vygotski’s theory of social constructivist is the best for the majority of learning.  The “More Knowledgeable Other” and “Zone of Proximal Development” seem to make so much sense to me.  I would have had to change my attitudes when at primary school because I think I would have felt embarrassed breaking into groups and learning off my peers, as is the suggested way of constructivist theory.


Figure 3.  Movie: Piaget & Vygotsky in 90 seconds. Sourced from Youtube video, 
https://www.youtube.com/watch?v=yY-SXM8f0gU

Having admitted to being constructivist, the use of the web 2.0 tools would serve me well as a teacher.  We have learned about Wiki and Google Doc’s, which serve this purpose.  I am yet to narrow down how I am going to exactly use these tools in the teaching environment: biology seems to have so much behaviourist learning.  Geography, my other teaching area, would make better use of these tools due to the more Social-Studies-nature of the subject.  I was not initially a fan of Wiki, as were my peers, but I am seeing their value in ICT teaching.

Legally safely and ethically has been continually outlined in tutorials as an important topic.  This was first covered in week 2 of the ICT course.  I am not entirely sure if I have been working legally.  For example, the images I have copied from other web-pages are shown, even in this blog, open to the public.  I am of the understanding that if I use another’s clip art or picture, for education purposes, the web-site I show it on should be password protected to allow only the students to view it.  Further clarification will be needed.  I intend to become a collector of images so that I can use my own images for presentations.  I knew a journalist who took a photo of anything and everything she thought was interesting to have an image library, I know now why.  

Ensuring professional reputation was another legally, safely, and ethically issue constantly brought up in class.  I am generally fearful of my teaching career lest an inappropriate image of me might be taken or my facebook account, for example, is hacked.  I am teaching secondary, so this is a real possibility.


*Steep but achievable learning curve*


All-in-all it has been an interesting journey and good learning for me.  The learning curve has been steep, but not impossible.  I will have to consolidate this learning with future practice.

Sunday 6 April 2014

Week 5 Reflection 5


Technologies for ICT


Introduction. This week I have written very briefly on all the suggested optional activities to demonstrate I have done them and am fully participating in this ICT course.  I will focus on Google Earth as my choice of technology.  On this occasion I will not try and sell Google Earth to the reader.

Create your own Animation


Interactive learning objects.  Appears to be a recycling of others material.  Wonder if it is worth it because the search would take a long time and if that search found no results, one could have been spending time developing the resource.  I can see some application for it.  The Gapfinder technology, added to the moodle interactive learning objects page, is a very interesting tool and I can see it would have some applications in my subject areas.


Adobe flash.  Interesting tool.  The old ‘chestnut’ that I don’t have time to learn it would probably fit here.  It is a tool for the computer savvy and I am not sure of its applications in high school and in the subjects I teach.


*GoogleGoogleGoogleGoogleEarthEarthEarthEarth*


Google Earth (my focus for this reflection). The Google Earth provides a service which is almost fantastic to me.  I have been in the business of sourcing aerial photographs since 1998.  Back in those days, if you lived in Brisbane, you could visit the Department of Primary Industries near the Gabba and view aerial photographs for free in their office.  If you wanted a copy of the photograph it costed about $60.  In later years I worked for Councils (2001) and these aerial photographs were beginning to appear as overlays on the computer with GIS systems (a similar thing to Google Earth); and when job seeking one had to be able to put on their resume that you could operate GIS (something primary school kids are doing today).  The fact that Google Earth, although limited as I mention below, is available for free on the internet is amazing.


So how can Google be used in the classroom?  The Google web-site describing the features for Google Earth to students, ‘Google Earth for Educators’(click for link), is reproduced, in part, below.  I found the formulation of words concise and descriptive, therefore I have cut and pasted this section from the web-page...


Students can use Google Earth to explore topics like the progress of human civilization, the growth of cities, the impact of civilization on the natural environment, and the impact of natural disasters like Hurricane Katrina. Teachers can use Google Earth demos to get their students excited about geography beyond the static map, or use different Google Earth layers to study transportation, demographics, economics, and in specific local or exotic contexts.
Below is a list of several other ways students and teachers can use Google Earth.
Students can use Google Earth to:
  • Explore the animal kingdom and endangered species with the National Geographic layer and other content. Easy
  • Create annotated place markers indicating location of school and points of interest in their town such as the local fire and police stations, the city library, local parks, and museums. Easy
  • Study climate change and the effects of global warming.Average
  • Create tours of their school or community. Average

Google Earth is relevant in geography in that the Australian Curriculum for Geography, years 7 - 10 course planner, states that "identify, explain and evaluate trends, patterns and relationships using topographic maps, satellite images, aerial photographs and other graphic representation of data." Google Earth clearly has some of these features.


The Google Earth for Educators also contains lesson plans.  Looking at these plans, they seem very good and would be able to be adapted for Queensland school lesson plans (they appear to be for American schools).


When exploring one of the features (that I was able to get working), historical aerial photo, I noticed the historical photos of Rockhampton and Brisbane only go back to 2001; the historical photos of New York (U.S.A.) go back to 1974.  This feature, of watching cities and landscapes change, does not seem to be as useful as purported.


On separate web pages there are layers available on a Google Earth tool; this page is called Google Earth Gallery (click for link). There are many layers available to choose from a menu. Not every country has the same layers available; for example, Sumatra has several layers for de-forestation and habitat loss, Mexico has a layer for percent tree cover, and the Arctic Tern migration. Regarding the Arctic Tern migration, I was unable to find any Arctic Tern routes after a quick circumnavigation of the globe; therefore not all these items workout the way you want them to. Also, there is a large amount of information for Sumatra's ecology, however, there is not a key to tell you what the different colloured layers mean: a very bad oversight. Although these layers are limited in scope one must be appreciative that they are on the web for free. They can be a good resource for educational purposes.

Google Earth, while having the purported good functions mentioned above, does not have all the functions of a primary school atlas, such as...
  • The trails of Australian explorers
  • Historical maps of the States of Australia
  • Demographic data
  • Average rainfall
  • Floral emblems
  • Past Prime Ministers.
It is therefore not an adequate substitute for an Atlas, especially a primary school atlas.  Also, having worked for Shire Councils, the photographs are not as detailed as those available on Council GIS systems: these are able to be zoomed-in with much more detail.  The Council photos are taken by aerial photography and I believe that many of the zoomed-in photos on Google Earth must be aerial photos as well.  The Council aerial photographs also go back further than those on Google Earth, to about the 1940s for Rockhampton.


Below is a photo from Google Earth of my first country town posting when an Environmental Health Officer.  I chose this photo because it was more simple than a photo of Rockhampton, which would have shown no detail.


Picture 1. Map of Barcaldine, geographic center of Queensland.


Table 1. Google Earth SAMR Chart.


Substitute
  • Draws and draws of paper maps
  • Draws and draws of paper photographs
Augmentation
  • Information with layers
  • presentation with being able to shift the screen instead of joining to another map

Modification
  • Road maps are able to be modified with routes being shown
Redefinition
  • GIS systems like those used in Shire Councils
  • Open to the public for easy viewing instead of physically visiting a government office.


Google Maps.  While I consider Google Maps a very useful feature, and have used them for mapping my personal journeys in car trips, I do not see them as very useful in Geography studies or Biology studies (my two special teaching areas).  One is benefited by knowing something about the route beforehand: on several occasions I have shown my Google Maps route to an experienced traveler and found the road mapped was rough and unsealed.  Google maps, while taking you the shortest route, does not consider road surface, closures, tortuous routes, etc.  A feature that may be useful is placing photographs and notes on a Google Maps route.  Say, for example, a school bus tour, a student could place notes and photos along the map for later revision.  Shown is an example of a car route that I have fixed up by re-routing the streets with a drag and drop feature (the little circle on the route can be dragged and dropped with the mouse).  It still has wrong information in the written directions (not shown) by asking you to make a U-turn at the beginning of the journey - I am unsure why this is.  Google maps appears to have floors.


Picture 2. Route from CQ University to Customs House, Rockhampton.


Create your own Animation
Online Timelines. The Dipity site shows a very useful tool for educators.  I can see a use for this in areas such as biology when studying the history of DNA, for example.  Similarly, it could be used in Geography for mapping events like floods and landslides and actions taken after them (a branch of physical geography).  One of our text books, Dimensions of Learning, recommends the learning tool of timelines. I like it.


Zooburst.  An interesting program.  I fail to see the good use of it in high school, but it may captivate and hold interest for the younger primary school students.


MuseumBox.  This seems to be a tool used for a simple presentation to the student at a self paced style.  One can view the sides of the box in the order that interests the viewer rather than the linear way slides are presented in, say, PowerPoint.  It does appear to be limited in the amount of information that can be described.


References

Australian Curiculum: Geography years 7-10 Course Planner. (2012) ACARA.  (as seen on moodle for Central Queensland University) (http://moodle.cqu.edu.au/mod/folder/view.php?id=235029)

Sunday 30 March 2014


*PowerPoint is the Teachers Bread and Butter*


This week I shall present Microsoft Powerpoint as my idea of the best tool for teachers.  I understand some teachers notion that, as one has put to me, ‘Power Point has been done to death’  (meaning it has been used so much that it has been overused and has become boring to the students); however I do not think there is any escaping PowerPoint's dominance in teaching.  It is the only tool that one could say is the ‘bread and butter’ of teaching (meaning that it is the tool teachers use for presentations).  Even the teacher who made the ‘done-to-death’ remark, old and wise as he was, did actually use PowerPoint in his presentation to us.  If you are a teacher, it is most likely that you will need to be proficient in PowerPoint or an equivalent program that does the same functions (more on a tool that can do this in the final paragraph).  


During our five weeks of this Graduate Diploma all of our tutorials and lectures have been presented with a PowerPoint type of slide show (given that other companies have their equivalent of PowerPoint technology).  This is an example of how widely used PowerPoint is at our own university.  Most of the PowerPoints have been used in the old fashioned ‘chalk and talk’ method where the written words are put on screen and the tutor in-person narrates the slides.  This may display a lack of skills in Powerpoint; however, I have noticed that when a background is put on the slides they become harder to read.  Personally, I intend to become an expert in Powerpoint.  I have not used it before this unit of study, which started only five weeks ago, but I can already see the benefits of knowing how it works.  I am surprised to learn that it has so many features other than the text-on-screen that we students see with our tutorials.  The user is able to: put a narration onto the slide show and can make the slide show start and advance automatically, or have the slide show advance by the users command; video can be embedded in the slide show; animations can be put into the slide show; an interactive quiz can be put in; photos and clip art.  Powerpoint is a very powerful tool.


PowerPoint also allows high order thinking, in the parlance of Blooms taxonomy.  Students can be tasked to put a PowerPoint show together with some basic training.  This has been displayed in this weeks subject readings for ICT in Learning Design, on the Universities ‘moodle’ site, where classes have put together a virtual museum.  It seems the name, virtual museum, is rather flexible and can mean all sorts of educational presentations.  The ones on the web site, a link here (http://christykeeler.com/EducationalVirtualMuseums.html), are to do with American culture and history.  What a great resource if an Australian museum sites could be made by school students!  It would be a very relaxing way to review Australian culture and history and have great benefits to education of students and the general public alike.  Although PowerPoint is not a web 2.0 tool, students are still able to work on PowerPoint individually, or in groups, and develop presentations in accordance with a scaffold given by the teacher.  Students are able to work within Blooms (1956) cognitive processes of remember, understand, apply, analyse, evaluate, create.  Teachers are still able to be ‘Learning Managers’ and allow the students to explore their own learning with supervision.  


images.jpg

Figure 1: Bloom's cognitive processes.


SUBSTITUTION
  • ·         White board/black board
  • ·         Speaker when narration used
  • ·         In-person presentation when used over internet
  • ·         Old style film slides
  • ·         Old style printed pictures
AUGMENTATION
  • ·         Of presentation
  • ·         Audience participation (quizzes, etc.)
  • ·         Send via email and web page
MODIFICATION
  • ·         Photo’s
  • ·         Movies
  • ·         Animation
  • ·         Quiz
REDEFINITION
  • ·         Glogster
  • ·         Prezi
  • ·         Webpage
  • ·         Slideshow
  • Movie Maker/Video presentation (where the video is a set of narrated stills).

Figure 2.  SAMR chart for Power Point.


Figure 2 is the SAMR chart for this weeks topic of Microsoft PowerPoint.  SAMR, as shown above, stands for Substitution, Augmentation, Modification, and Redefinition.  It is a tool used for analysing a subject and, in this course, replaces other tools such as SWOT.  What do we learn from the chart?  In the first row, Substitution, we explore that PowerPoint replaces the old-style slide shows that we older people remember: film slides, put into a light projector, used to throw a large image onto the screen.  I can still remember slideshows used during my own university education that were just like the PowerPoint presentations of today.  People who have not experienced slides will likely have grandparents with film slides of photographs.  Keeping with Substitution in the SAMR chart above, PowerPoint also replaces the black-board and white board; it appears that teachers now use their text on walls exclusively with PowerPoint.  This has the advantage to the teacher that it can be saved and used from year to year; and also with behavioural management because the teacher spends less time with their back to the classroom.  PowerPoint can also completely substitute the teacher or lecturer with a narrated slide show.  This has advantages to distance education and with my own course, which is largely completely on-line even though I am a resident student.


In the Argumentation section of the SAMR model, a dot-point I would like to expand on would be audience participation.  PowerPoint can be interactive with quizzes or questions.  This makes it a more powerful learning device.


Skipping to Redefinition on the SAMR model, some expansion on the dot-points would be helpful.  With the opinion of the teacher that said ‘PowerPoint has been done to death’, mentioned earlier, alternatives such as movie maker were suggested.  An example of a movie maker presentation was shown to my class: this was a set of stills narrated with a sound-track.  This type of presentation can also be done with PowerPoint -- I therefore do not think it is a worthy substitution for PowerPoint.  Regarding the Glogster, I have viewed some examples of Glogster on the web and think they are nothing more than a tidied up web page: they seem to have all the same features and functions of a web page.  Regarding Prezi, this is a worthy competitor to PowerPoint and may catch-on in the future.  It seems to do all the same functions capable of PowerPoint and, in addition, able to zoom in on parts of the slide.  If really needing to zoom on PowerPoint, prior preparation would allow you to put in extra slides of the would-be zoomed photograph, if that is what was needed.  The fact that Prezi works from the ‘cloud’ and allows this zooming makes it a very interesting presentation tool.


As can be seen, with my limited knowledge on presentation and presentation tools, I think PowerPoint is what every teacher needs to know thoroughly.  It is the basic tool of presentations.  Prezi seems to come a close second, in my opinion.  PowerPoint may develop further, however, and outclass Prezi.  There are also other programs that are free that have (to my knowledge) the tools of PowerPoint, such as Google Slides.  Google may, in fact, overtake Microsoft with its free programs.  PowerPoint is the program of choice for teachers and that does not seem likely to change in the immediate future.


Bloom, B. S. (1956). Taxonomy of Educational Objectives, Handbook I: The Cognitive Domain. New York: David McKay Co Inc.


Image of Bloom’s Cognitive Process from,

www.tidec.org